
Build a Recipe and Prepare Your Data
Your Dataiku Launch Program - Step 3
Actions Panel
Start Your Recipe
Open a project. Select your dataset from your flow to see the Actions panel on the right. Explore the right panel navigation.
Next: Today, we’ll walk through the different actions you can take to prepare and enrich your data in Dataiku. Start by selecting a Prepare recipe.
If you haven't yet, start by exploring Projects and Datasets in Dataiku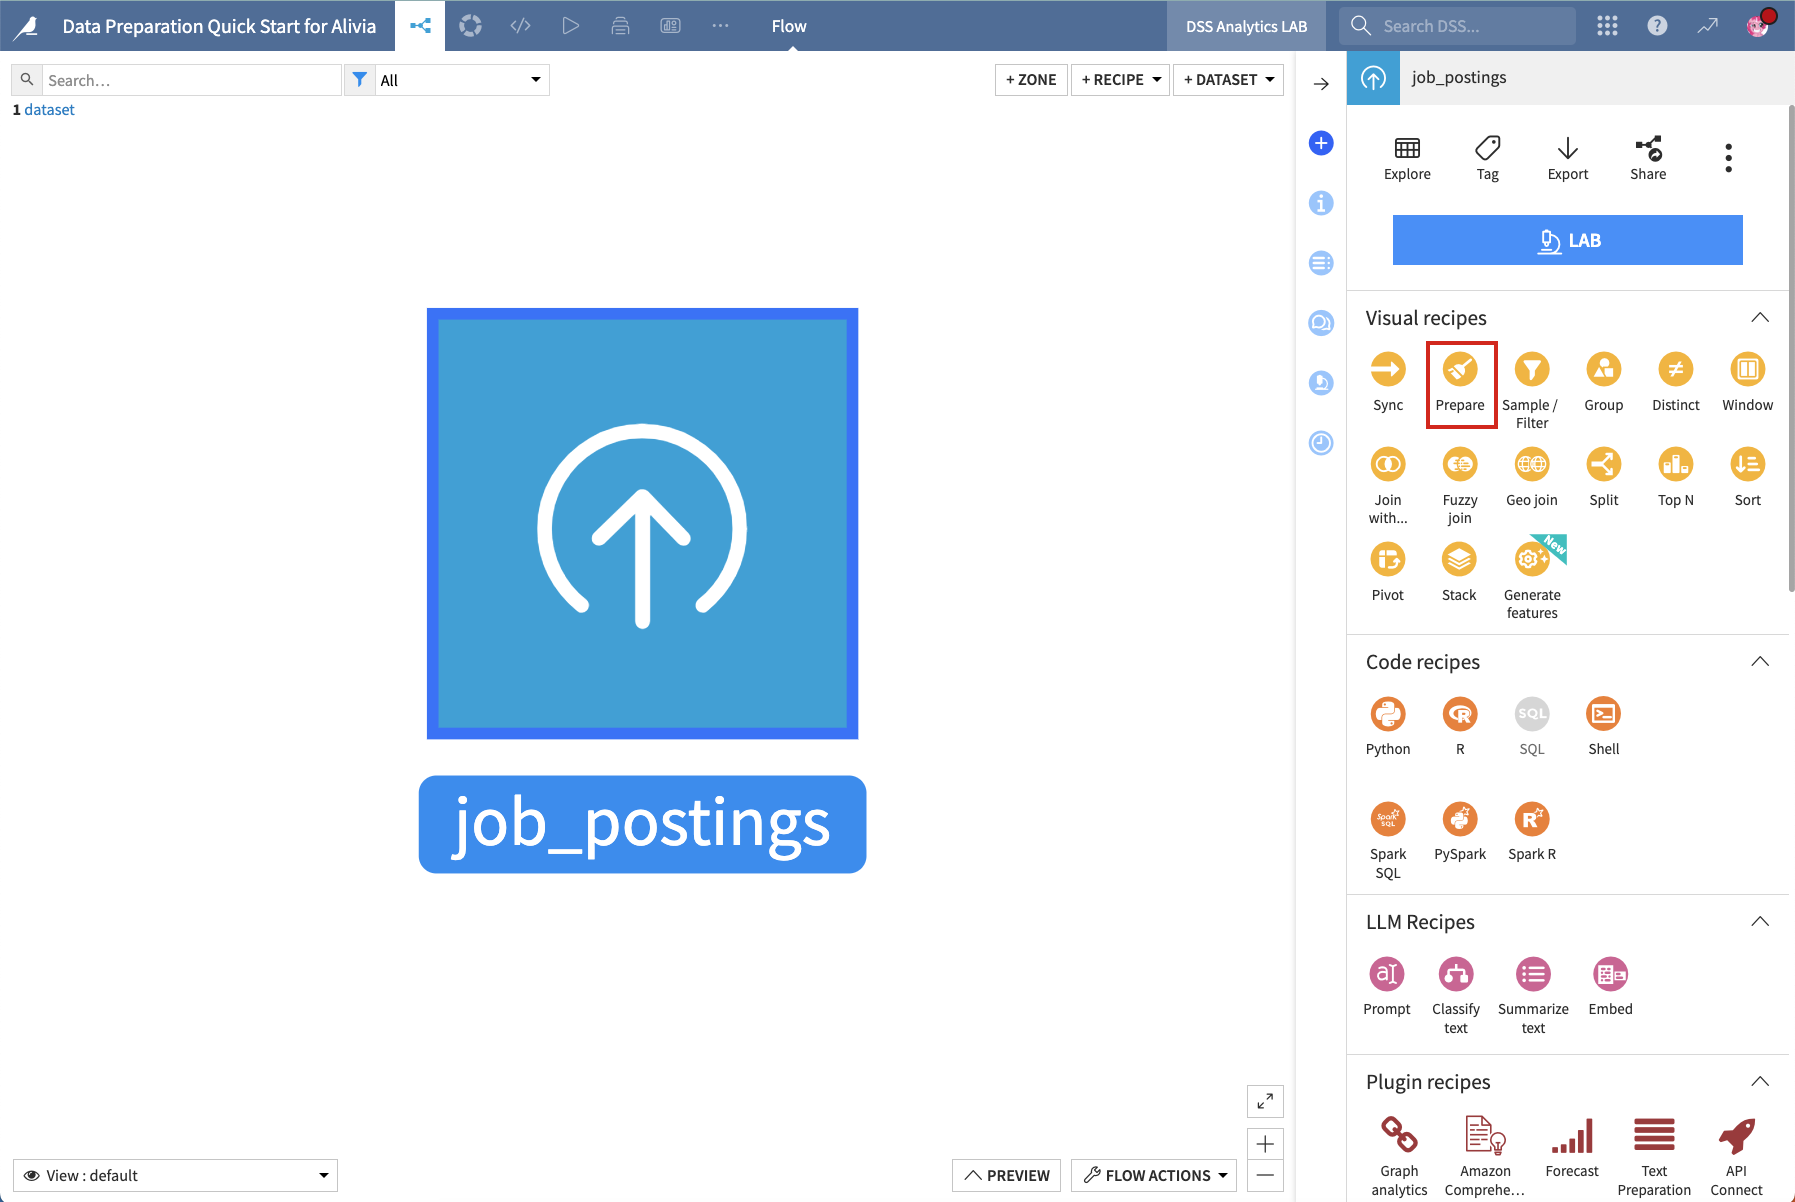
Prepare Recipe
Create a Prepare Recipe
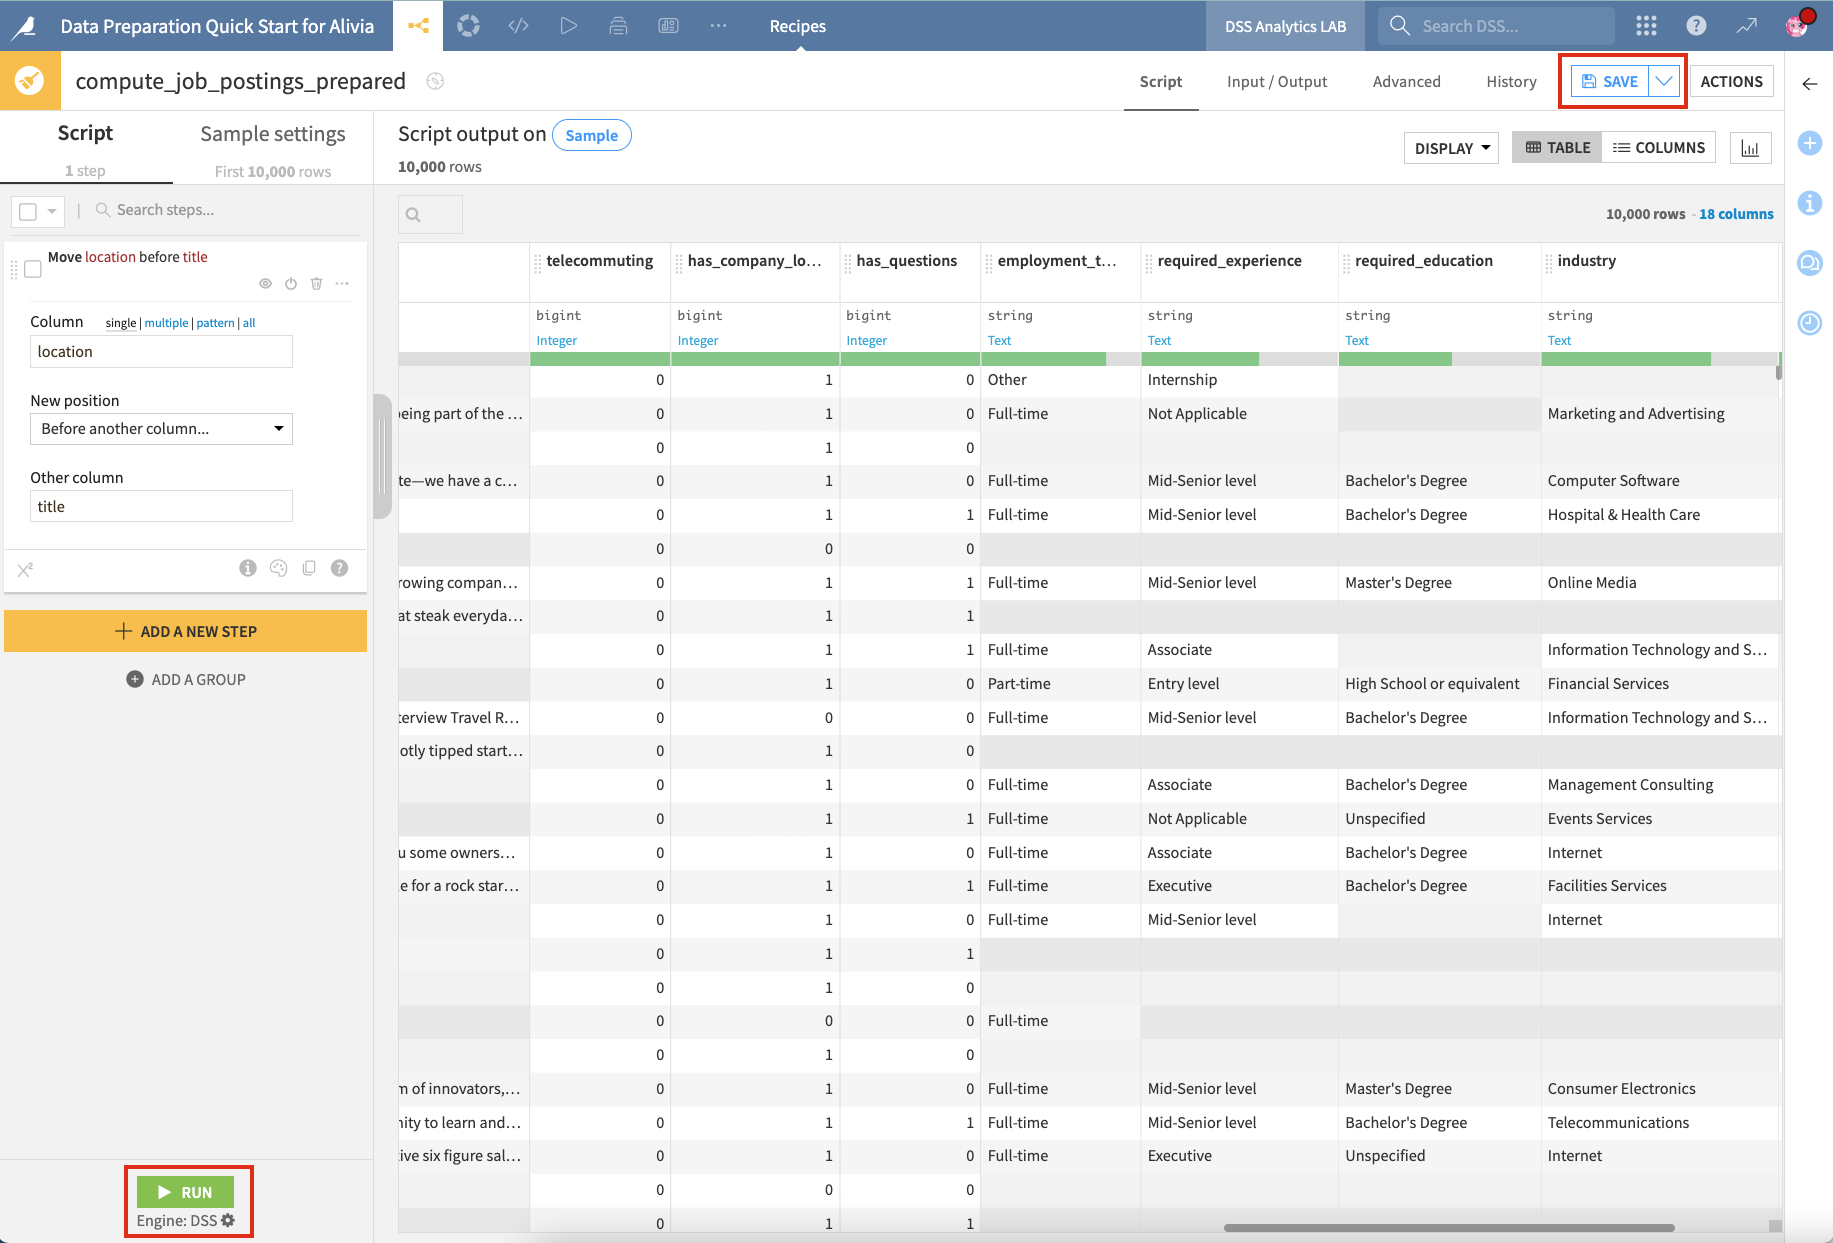
Click on a column header and move it to the right or to the left. Notice that this adds a step in the script on the left of your screen. This is your first preparation step!
Click on your column header to see the recommended preparation steps. You can act on empty values or extract information for data or location fields.
You can edit your steps from your script: delete them and rearrange them, preview the impact of a step by selecting the Eye icon, and deactivate a step with the Power icon. You can group them into recipe groups and add colors and comments to collaborate.
Your Recipe Steps
See Your Data Change As You Add Steps
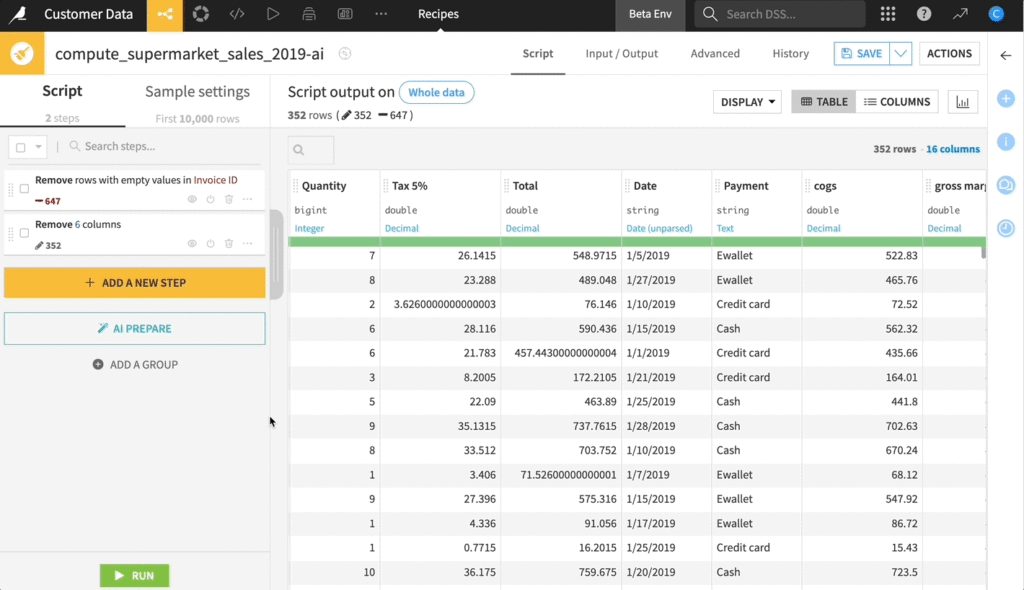
As you add or remove steps to your preparation, notice that they are added to your left sidebar as recipe steps in your script. You can see the output of these steps on your data.
Remember you’re working on a dataset sample and not changing your whole dataset live. You can edit your sampling to make it more representative.
Explore Dataset Sampling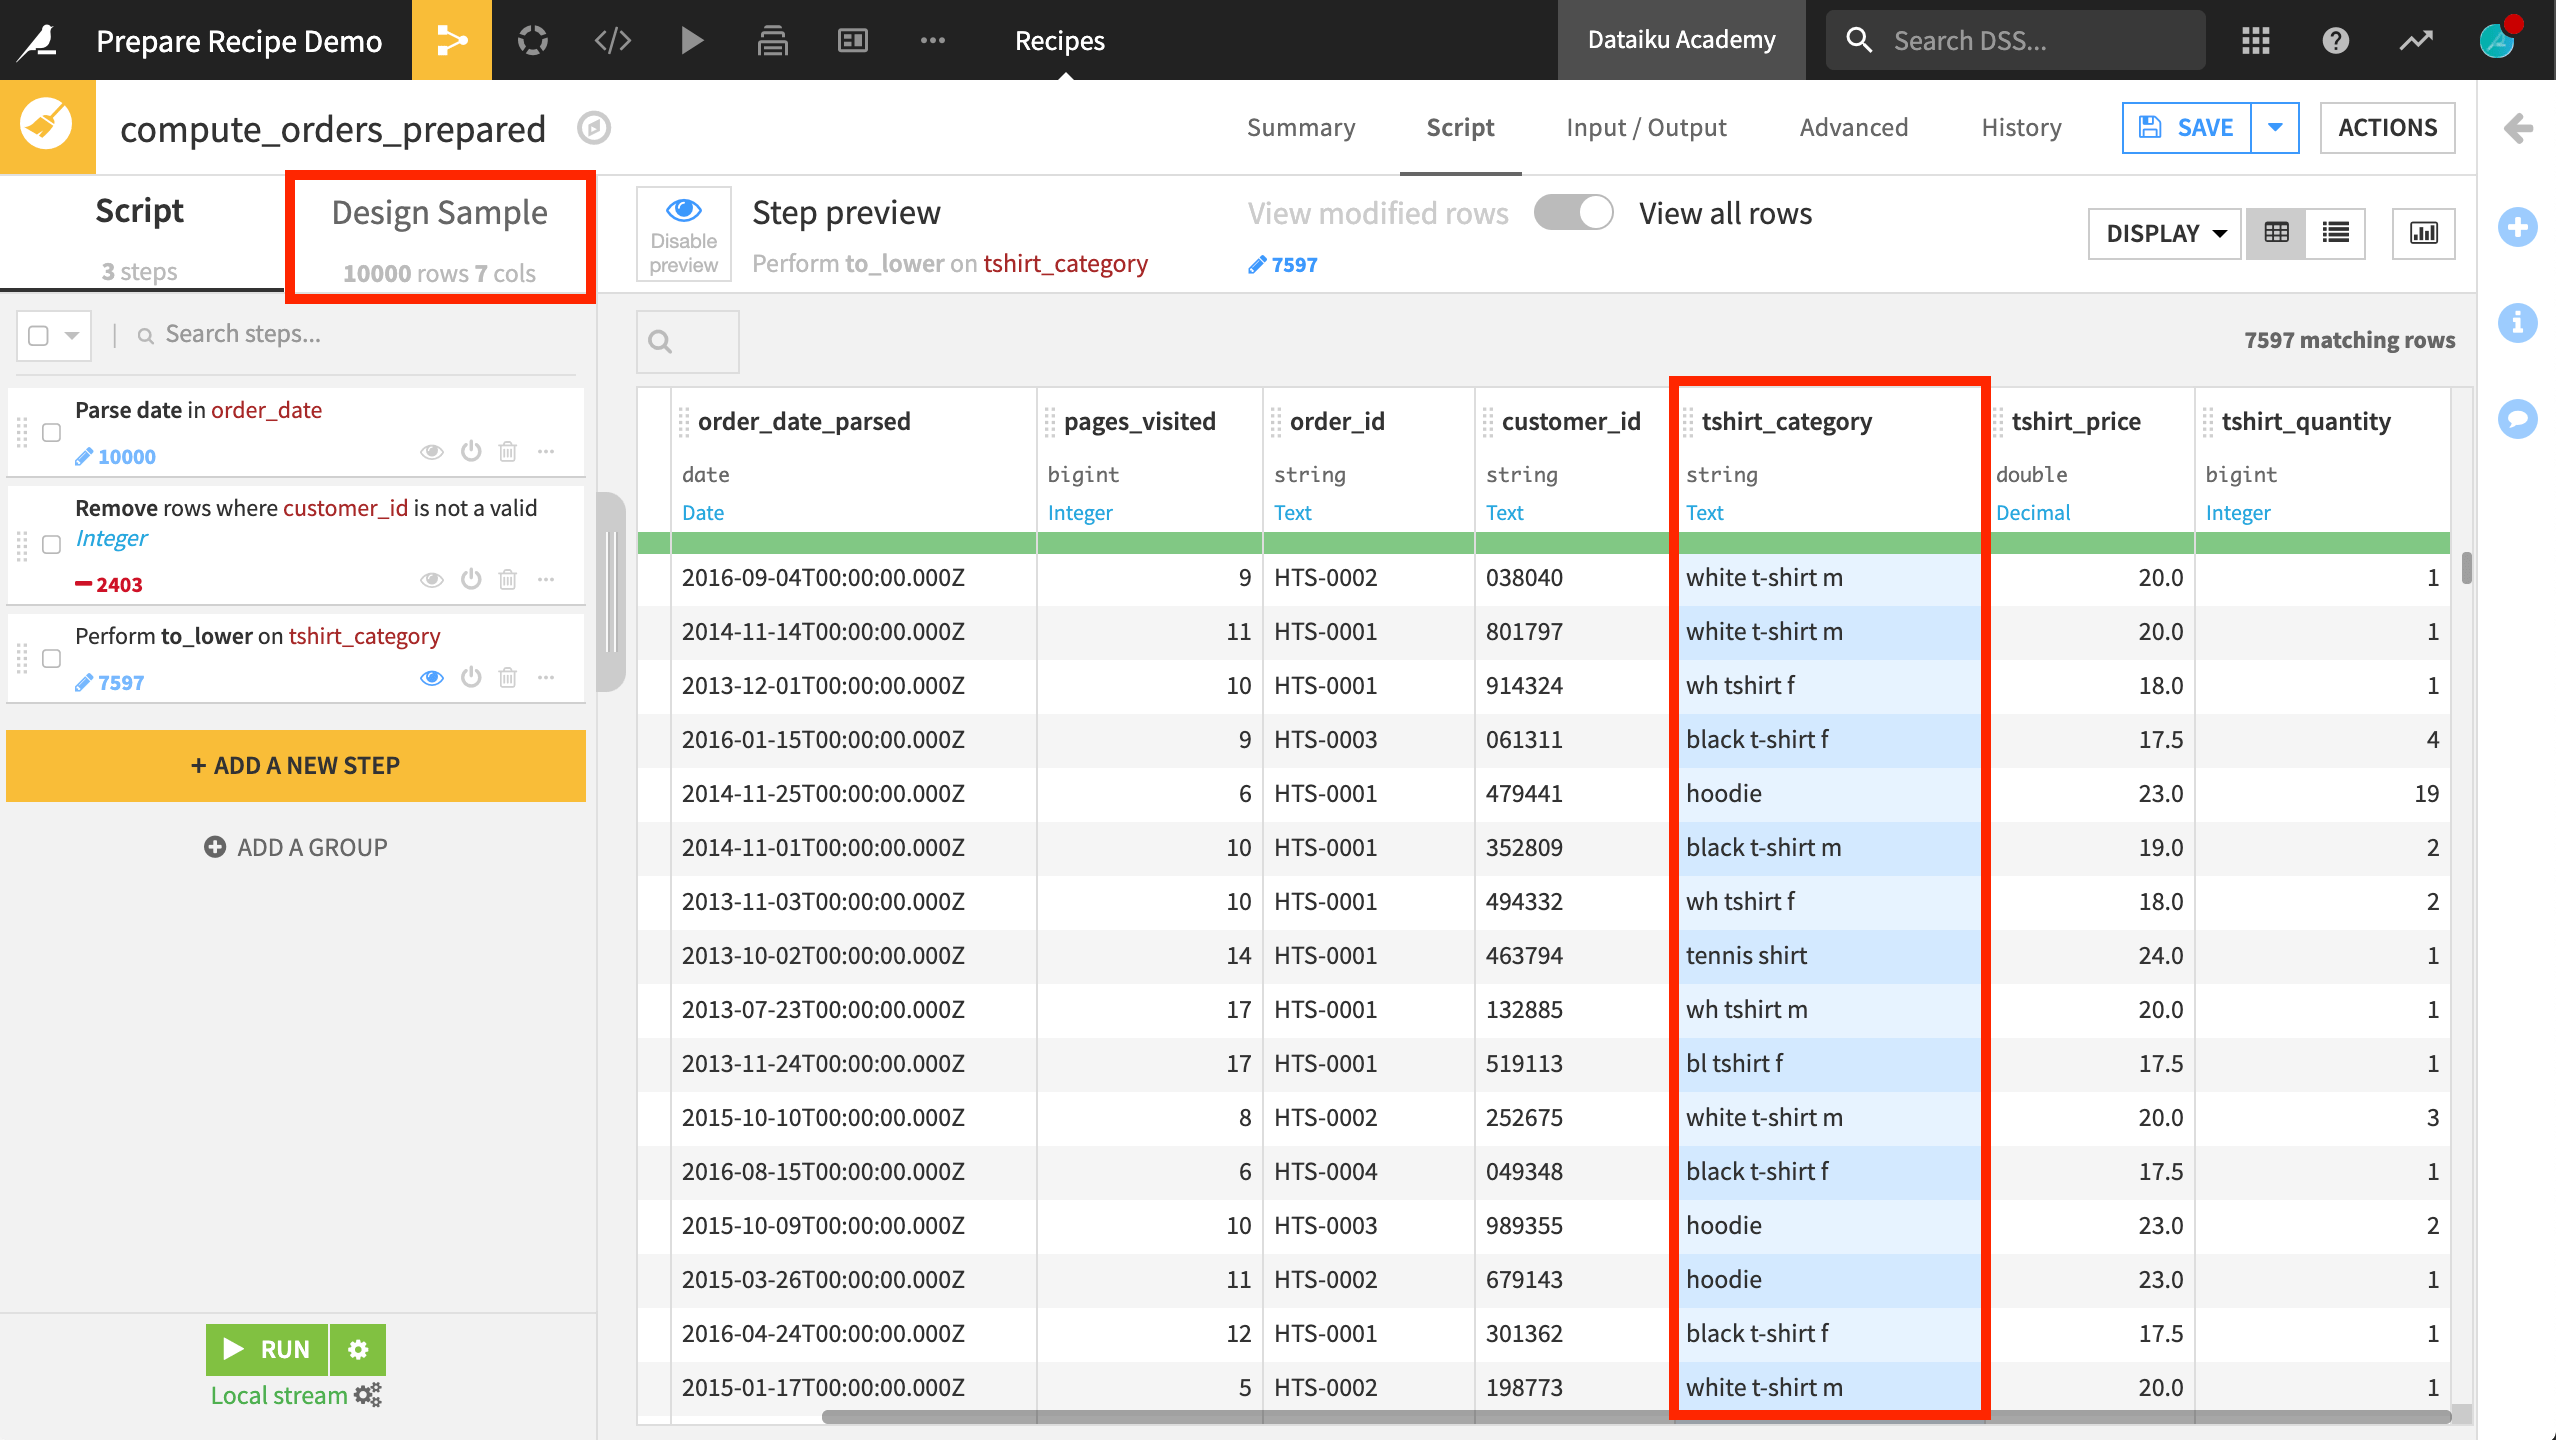
Prepare Recipe Processors
Choose From More Than 90 Data Preparation Processors
You can add steps to your recipe and choose from many different processors by clicking Add a New Step. These allow you to edit all types of data: format text, dates, geographic data, etc.
Read the documentation of all the Prepare Repice processors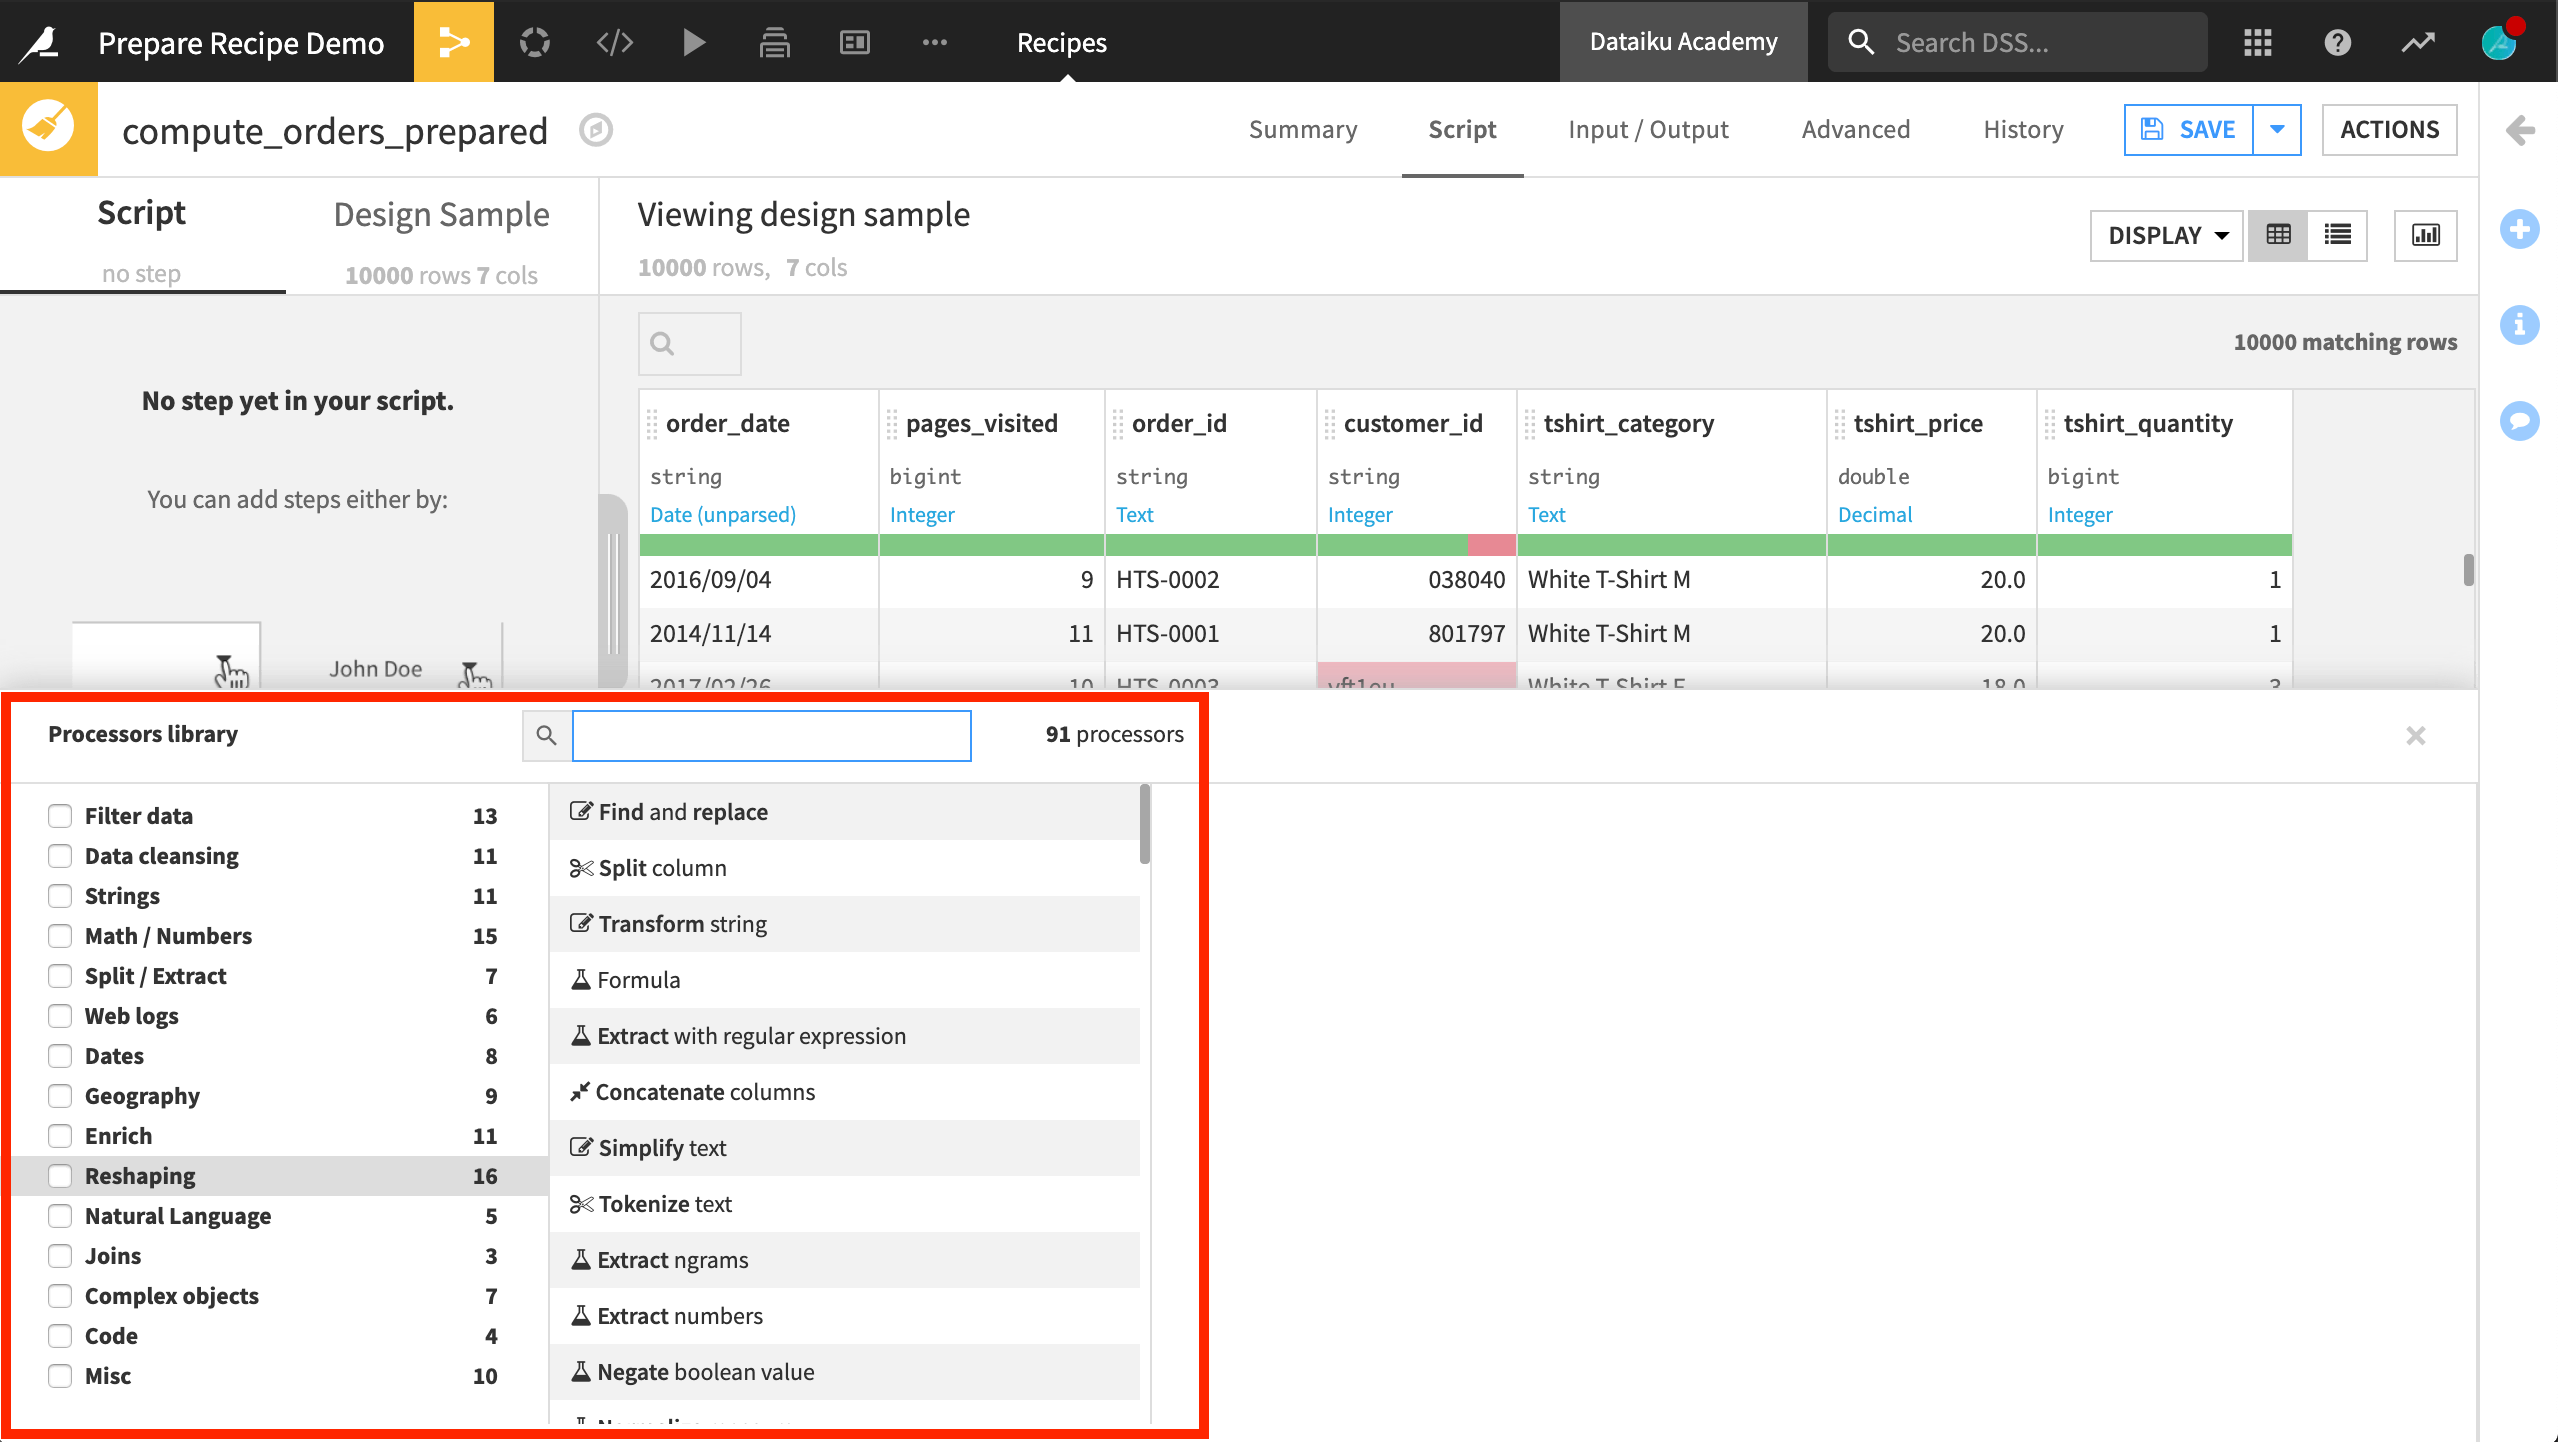
Formulas
Use Formulas to Push Your Data Preparation
Like what you might find in a spreadsheet tool like Excel, Dataiku has its formula language. It is a powerful expression language to perform calculations, manipulate strings, and much more. In your Prepare recipe, you can add a Formula processor to start working on more advanced data preparation.
Read the documentation on formula language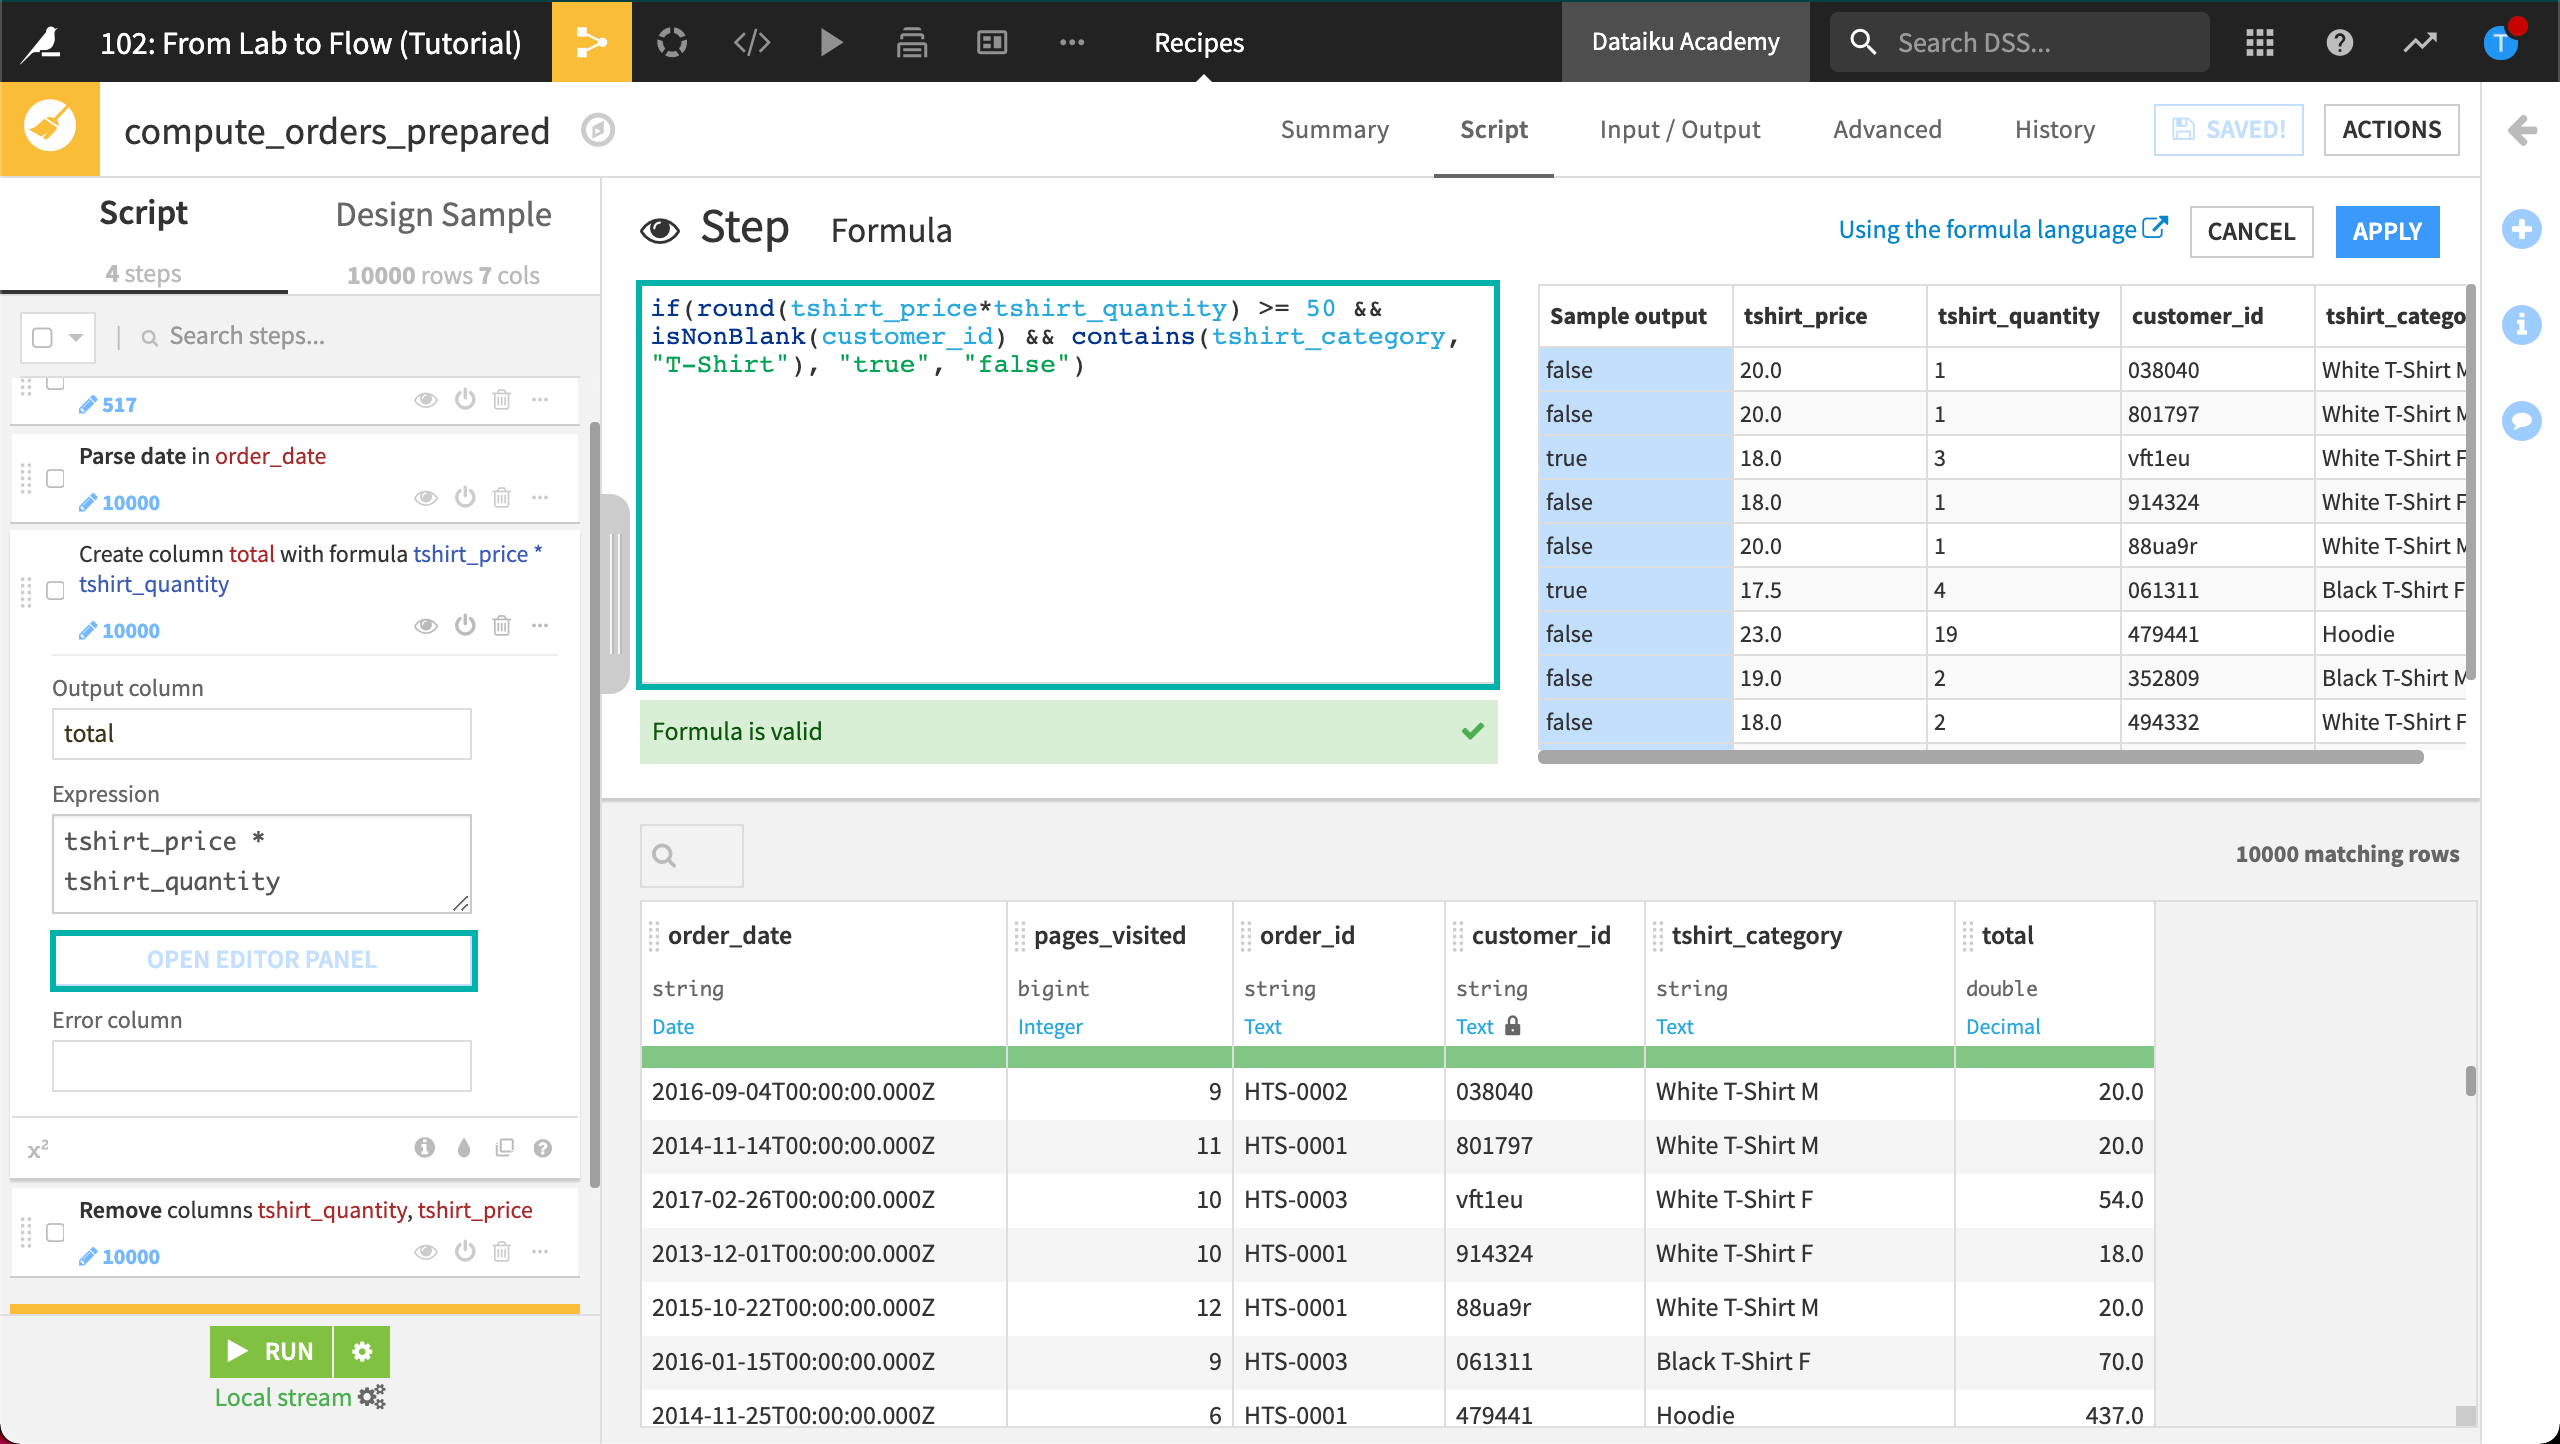
Charts
Build Visualizations On Your Data
Visualization is a critical tool in the data exploration and discovery process. The Charts tab of a Dataiku dataset houses a drag-and-drop interface for visual exploration. Many different charts are natively available, including bar charts, line graphs, pivot tables, and scatter plots.
How to Use Charts
Save and Run
When You’re Happy, Hit Save and Run
Make sure you click Save in the top right corner of your screen as you work so you don’t lose anything. When you have a first recipe you’re happy with, hit Run to make changes to your data and add your data transformation step to your flow.
Back to Your Flow
See Your Data Project Evolve
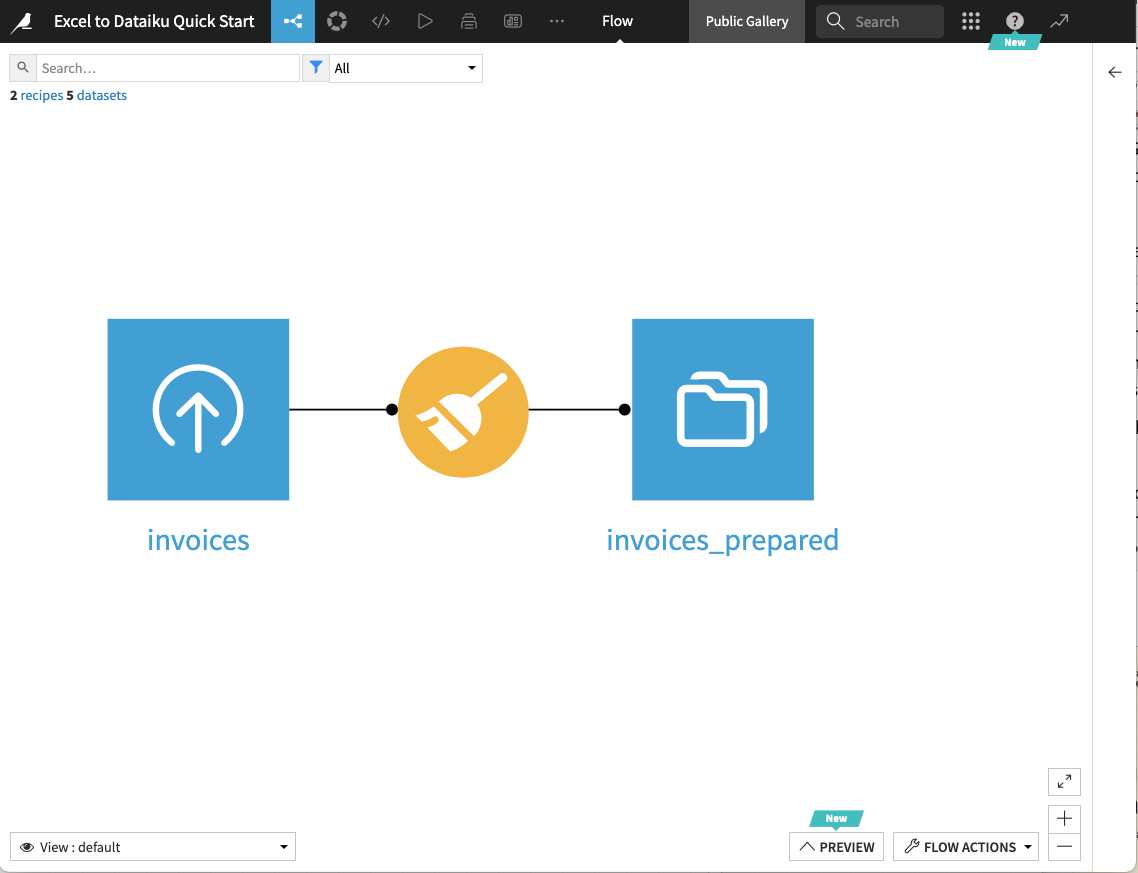
When your recipe has run, check back into your flow and click the Flow icon in your navigation, next to your project title, to access it. Your flow now has an additional recipe and a new dataset. Congrats!
Recipes
Explore all the recipes
There are many different recipes to explore, prepare, and build predictions on your data!
Using a visual interface, you can use powerful visual recipes to perform data preparation steps. Save time and anticipate replicability.
All Visual RecipesCode recipes, as the name indicates, execute code using languages like Python, R, or SQL, among others.
Code with DataikuUsing visual AutoML recipes, you can train and run machine learning models, predict a target, cluster, or evaluate a model.
Start Machine Learning in DataikuLeverage Generative AI from within Dataiku to extend your work.
LLMs in DataikuA plugin is a package of reusable components that extends the functionality of Dataiku. You can use plugins to connect to an outside tool for example, or package code to make it reusable. Build your own plugins or find the Plugin store in your
Dataiku Plugins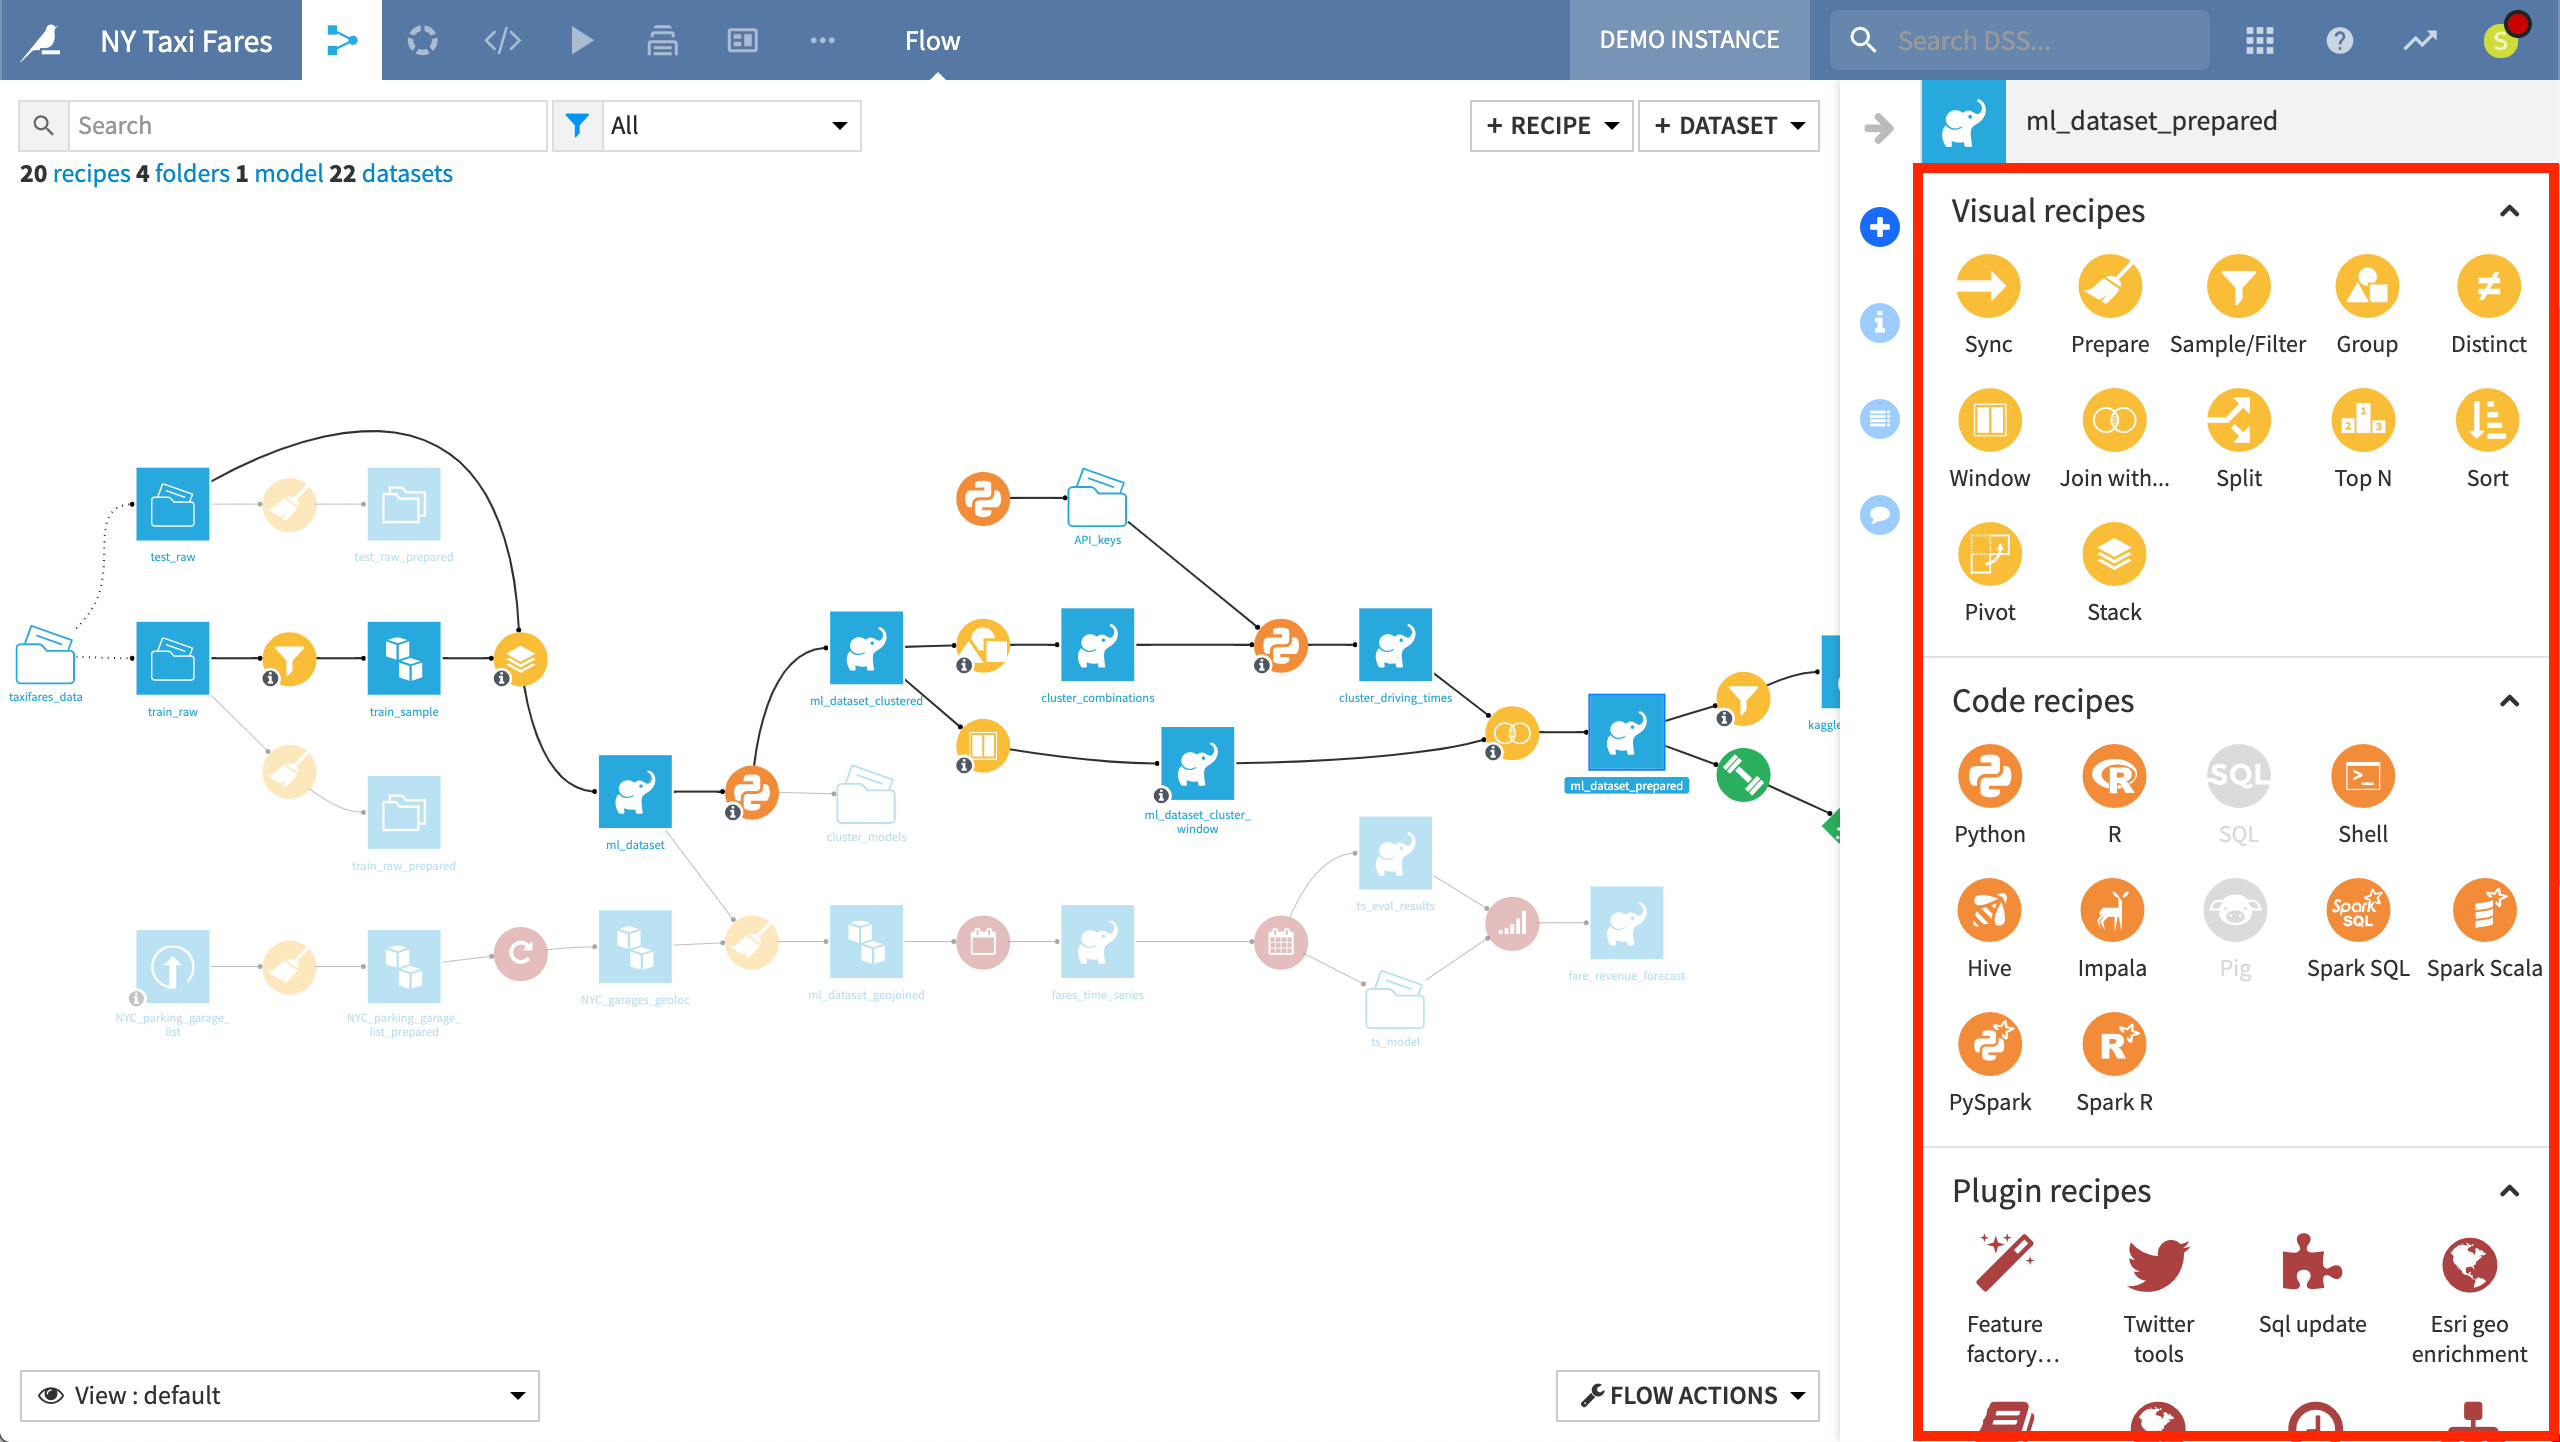
The Join Recipe
Work Across Multiple Data Sources
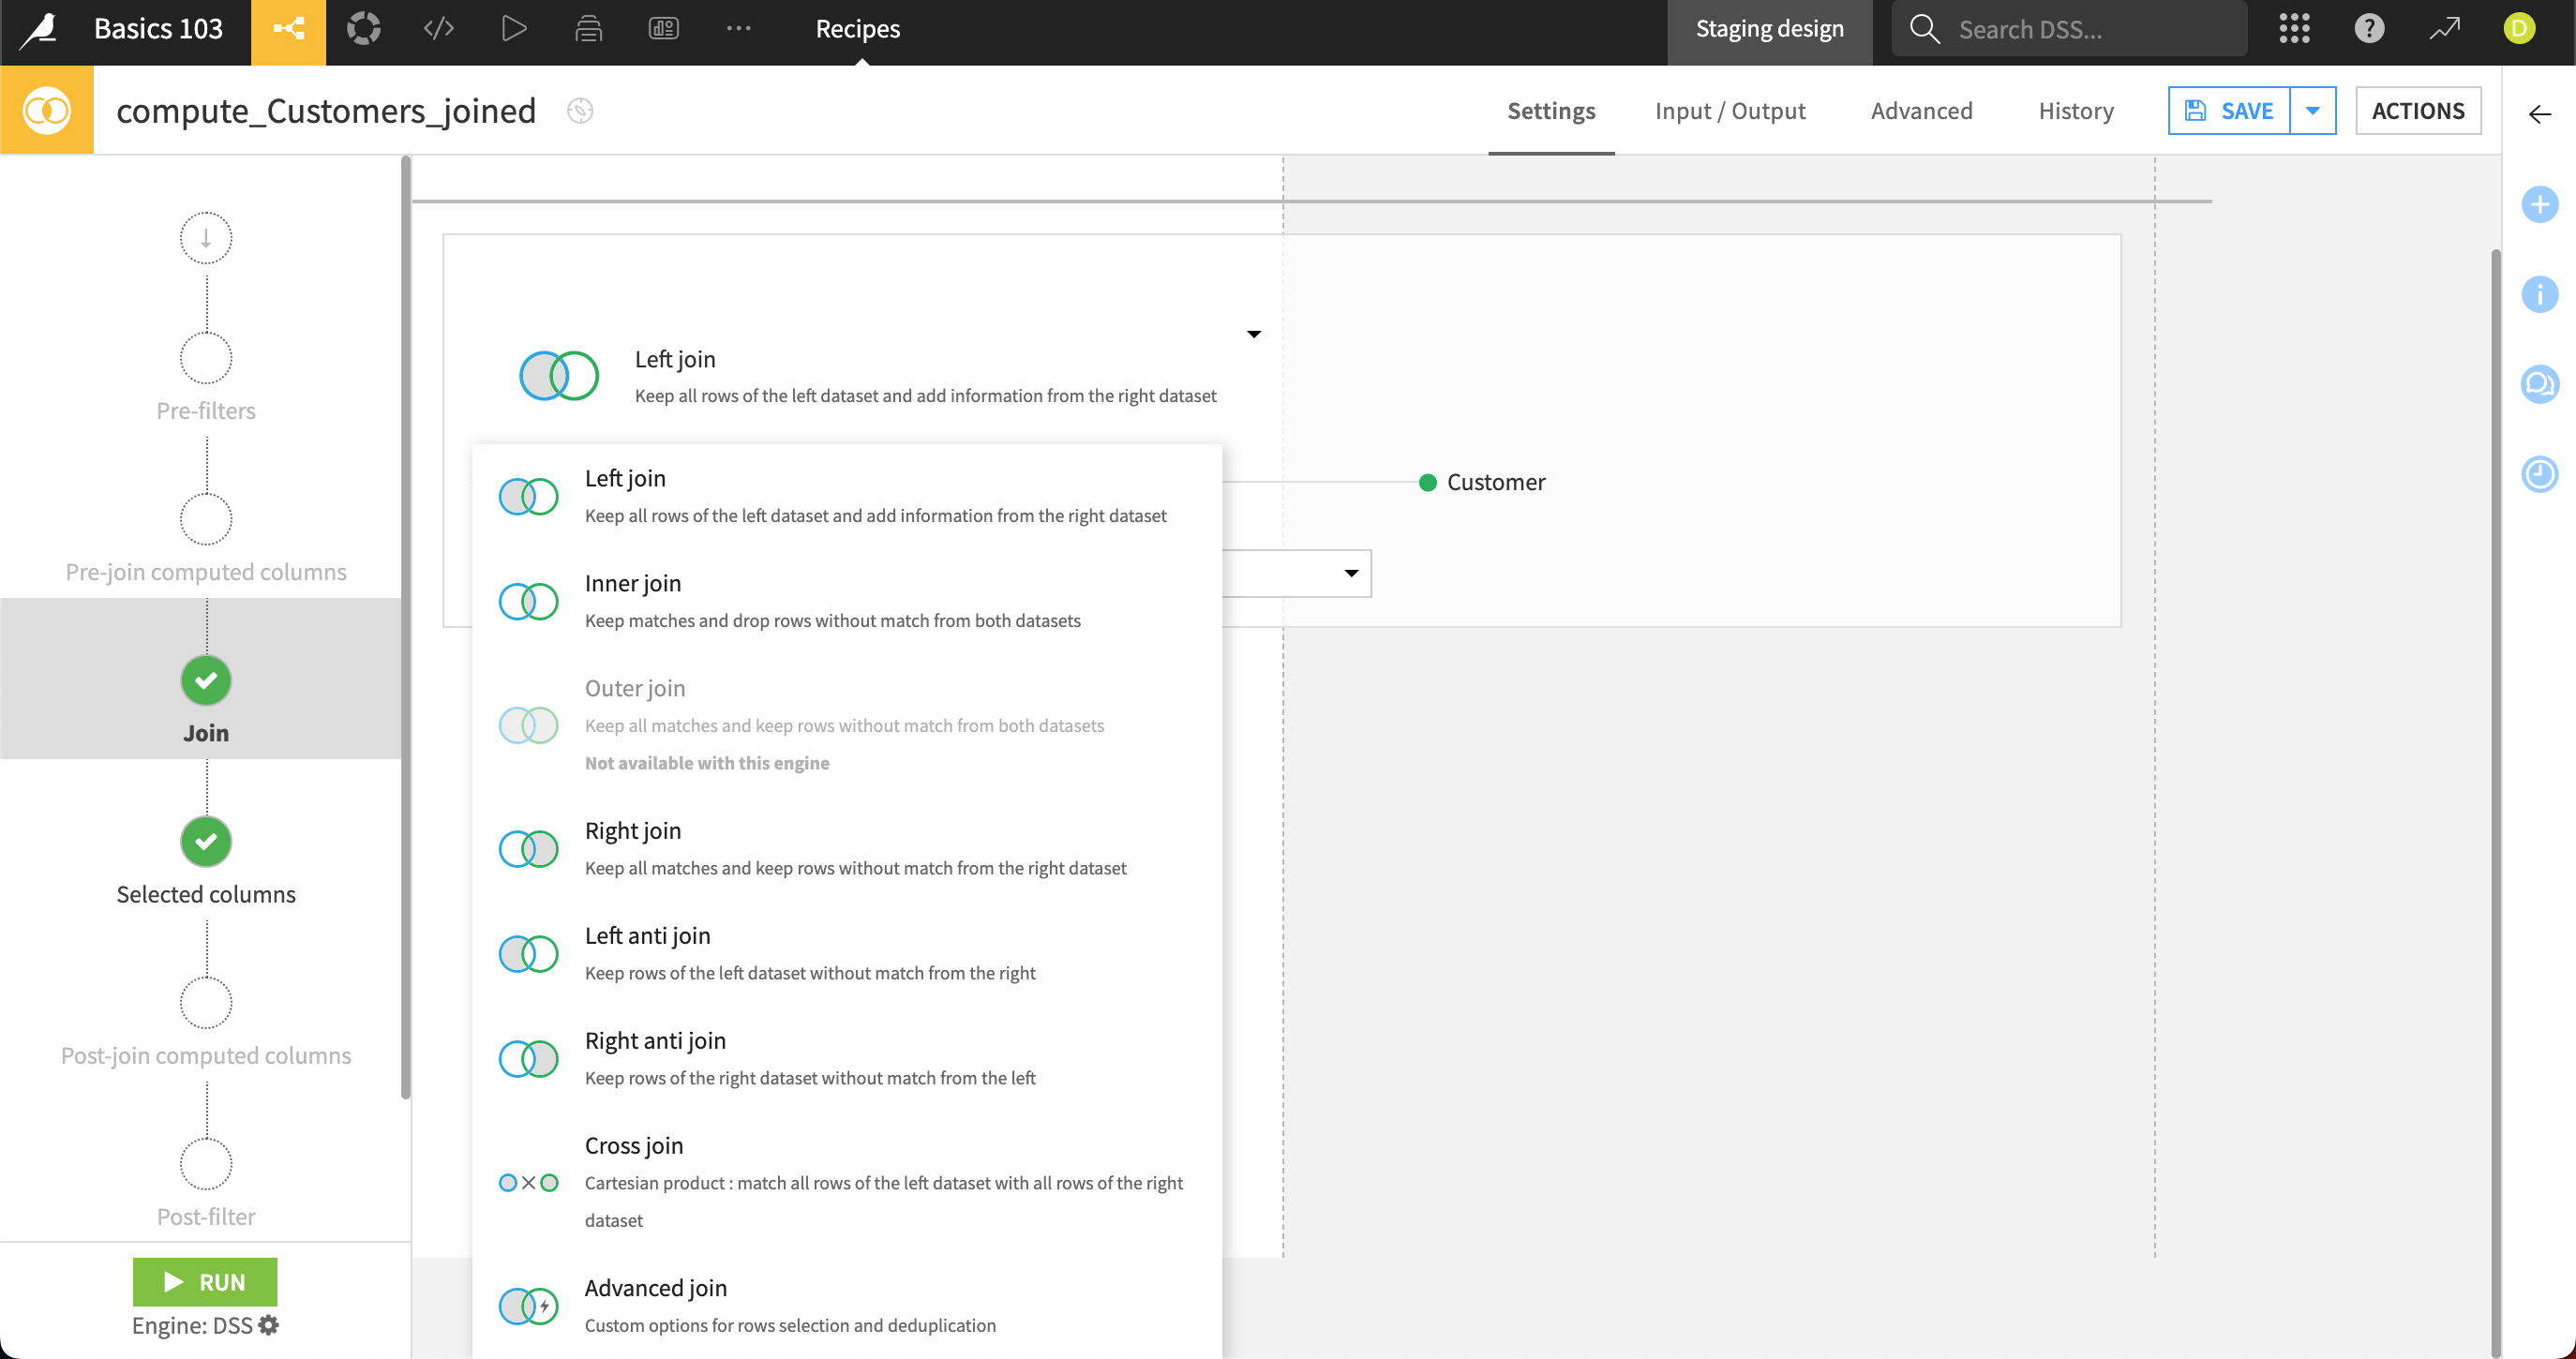
Use a Join recipe to connect two or more datasets. Set up a column to match, choose your join type, and select the columns to bring in.
The Group Recipe
Transform Logs Into Digestible Values
Group bys allow you to aggregate your data and add calculations for specific values. For example, if you’re working on transaction logs, you can group them by product sold and add a count of products sold, a sum of the revenue generated, etc.
Group Recipe Tutorial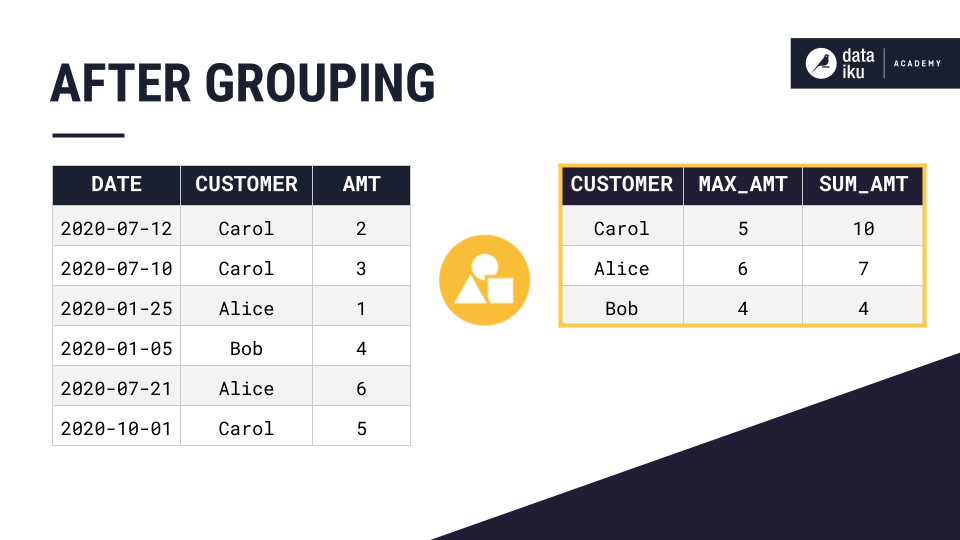
Generative AI
AI-Powered Data Preparation
Just describe what data preparation steps you want and let the Gen AI automatically create these steps in a visual recipe. Review and run!
We’re happy you’re here
Join a Community of Dataiku users
Have a question? Want to explore Dataiku tips? Share an idea you have to improve Dataiku? Explore great stories from our users?
Join the Dataiku Community© 2013 – 2024 Dataiku. All rights reserved Privacy Policy