Work on Your First Data Project in Dataiku
Your Dataiku Launch Program - Step 2
Homepage
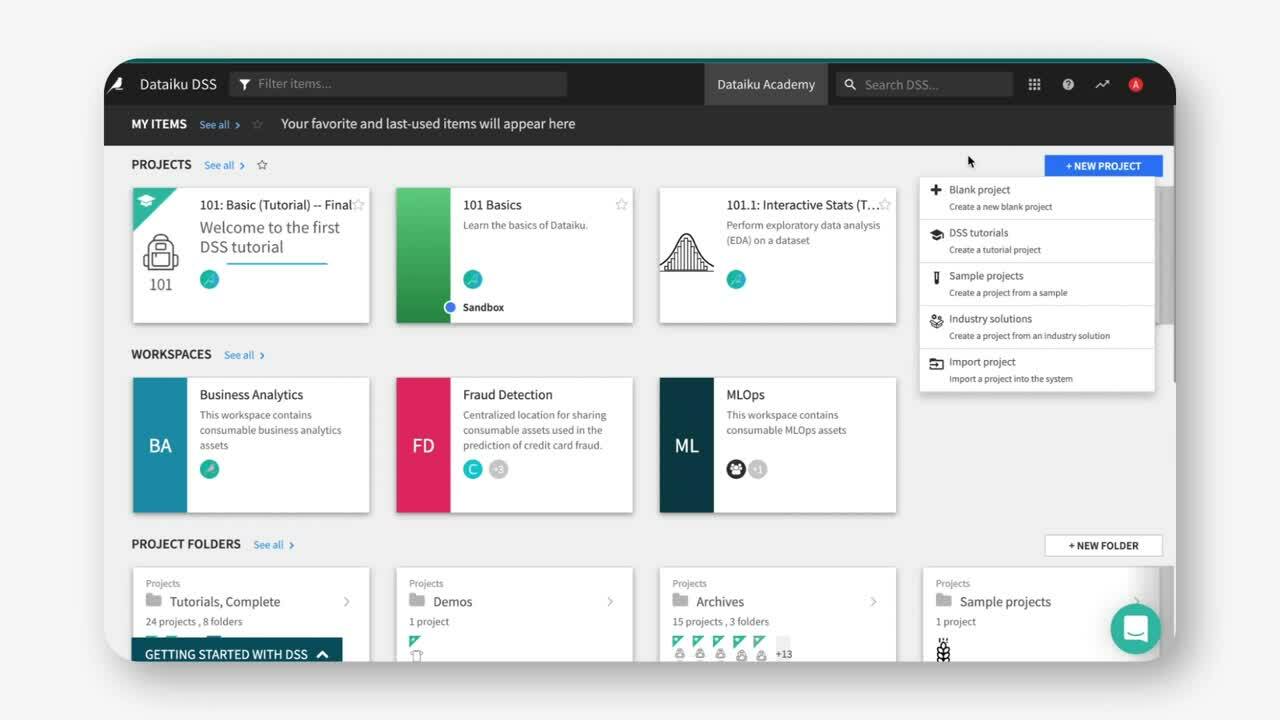
Your Dataiku Home Base
This is your Dataiku home, like the default front page of a website. This is where you start when you open Dataiku. It’s where you’ll find your projects, the projects shared with you, and where you can create a new project. It will show your most recent projects first.
Start here: Click on + New Project in the upper right-hand corner to create a new project or click on an existing project.
Projects
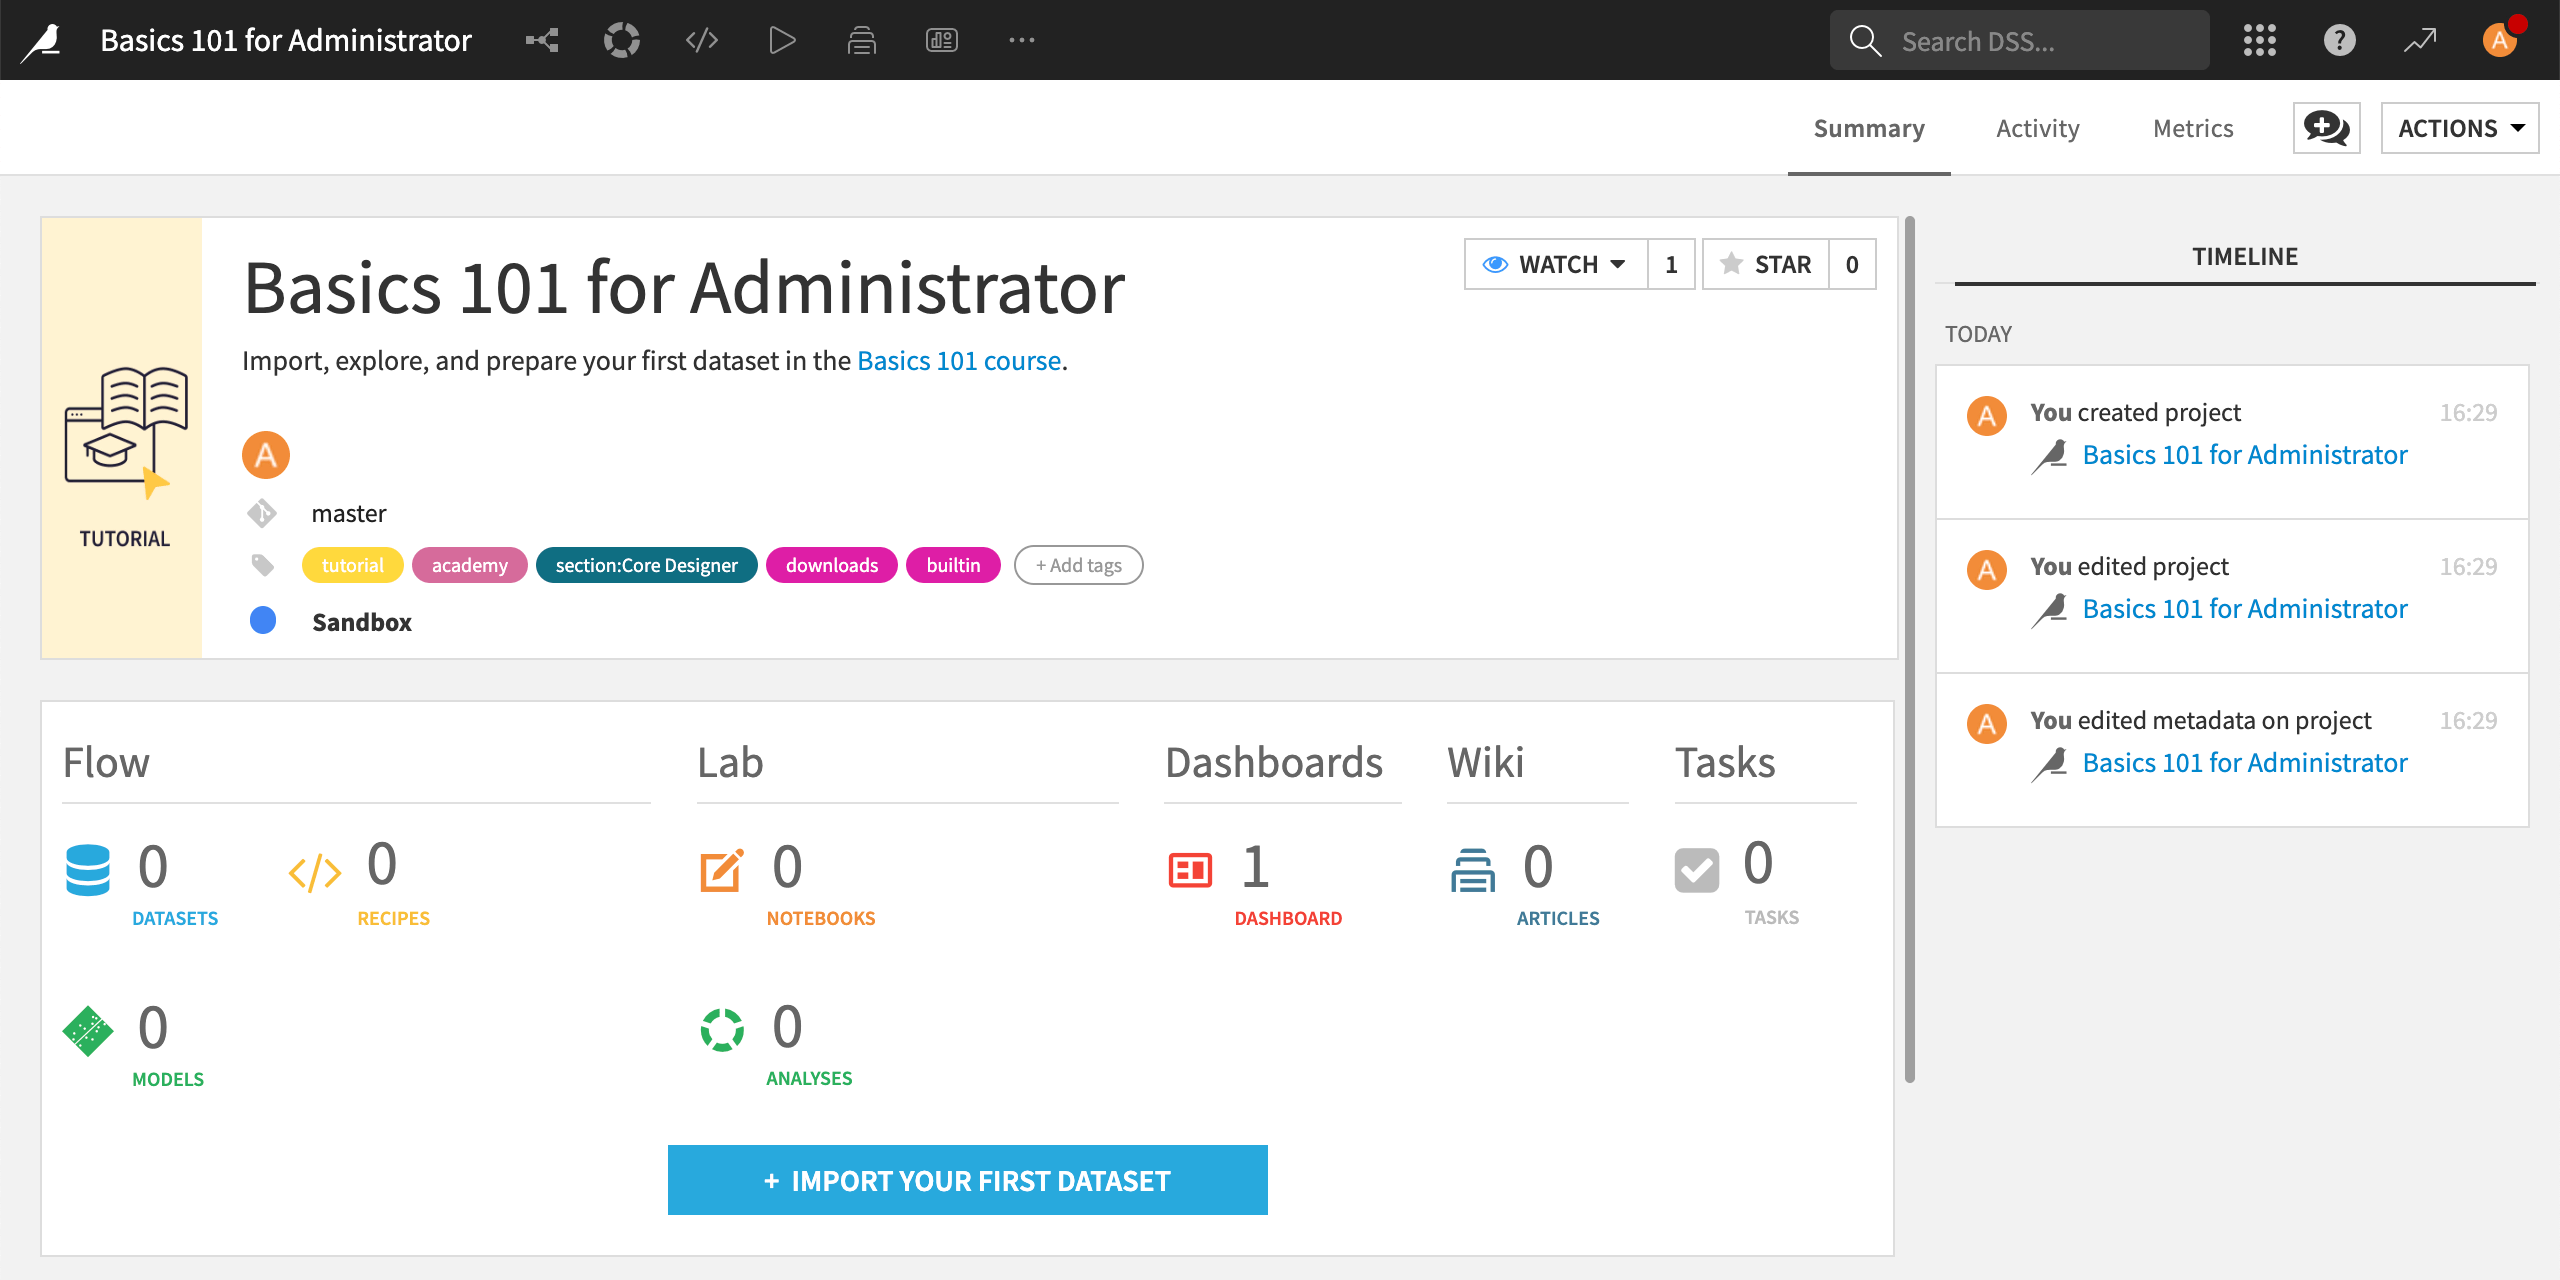
Where the Magic Happens: Your Project
The project is your command center. It contains all your work on a specific activity. For example, a project can include datasets, recipes, models, charts, dashboards, automation scenarios, a wiki, and discussions. Keep scrolling for all the different ways to start a project.
Important: You may not have access to any projects in your instance or be able to create new projects. If that’s the case, ask your Dataiku admin to help you!
Dataiku Gallery
The Easy Route: Start With a Pre-built Project
Walk through Dataiku features with guided tutorials from the Dataiku Academy. You can access these directly when you click to create a New Project.
Dataiku AcademyExplore complete projects built to showcase Dataiku capabilities. You can bring these into your instance and make them your own!
Explore Sample ProjectsDataiku Solutions are elaborate projects built by industry experts to answer most common use cases and accelerate the time to a fully productive data project.
Explore Dataiku Solutions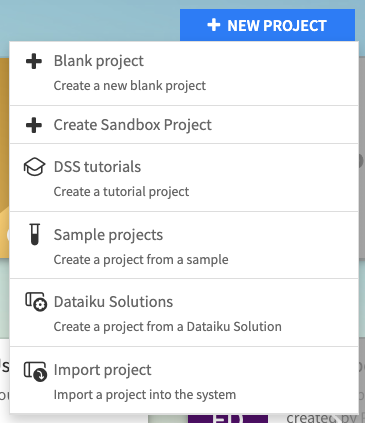
Dataset
How to Get Your Data Into Dataiku
You can bring data from lots of sources into Dataiku. In the end, it will come out the same: a dataset symbolized by a blue square.
You can upload your Excel or CSV data into Dataiku directly. This is a good way to start.
Most companies rely on data connections to connect to data sources and bring in data. Your account admin or data engineering team usually sets these up and maintains them.
The data catalog is the place to search all of your organization's data. Depending on your Dataiku installation this may not be built (yet!).
Learn more about the Data Catalog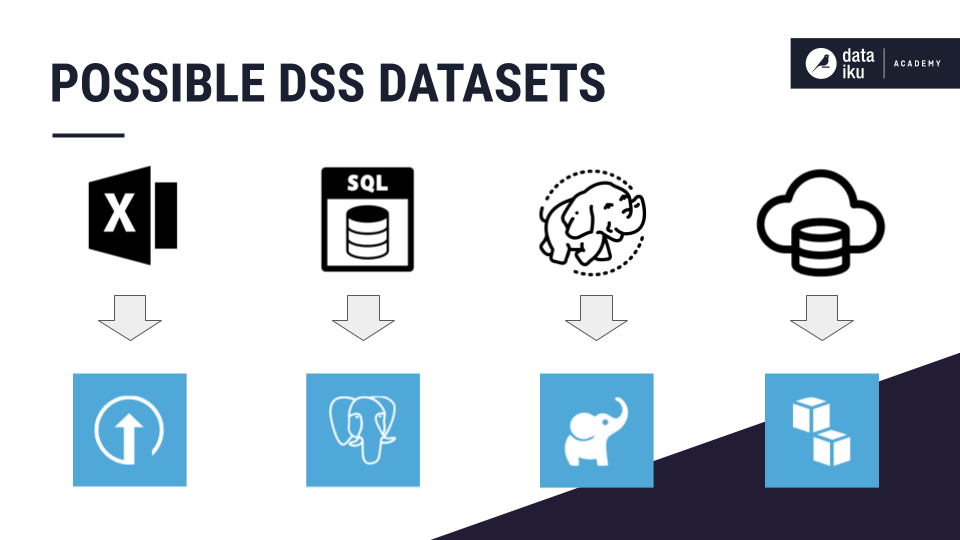
The Dataset Explore Tab
Start Exploring Data From Your Dataset
No matter your source – your data in Dataiku will come out in the same tabular format.
You can scroll through a preview of your dataset. Keep in mind this isn't your full dataset, only a sample. You will see a data quality gauge at the top of your column. These show you where you will need to work on the data quality.
These are automatically detected (but changeable) based on the data stored in a column. Based on these, Dataiku suggests possible data transformations and assesses the data quality of the column — the values that don't match the meaning.
Storage types are often set by the format in which your data is stored. They drive some of the transformations you can do. For example, joining can only be done with two key columns with the same storage type.
In the schema tab on the right, you can review all the columns in your dataset and their storage types. This is especially useful for large datasets with many columns.
Learn more about Dataset characteristicsSampling
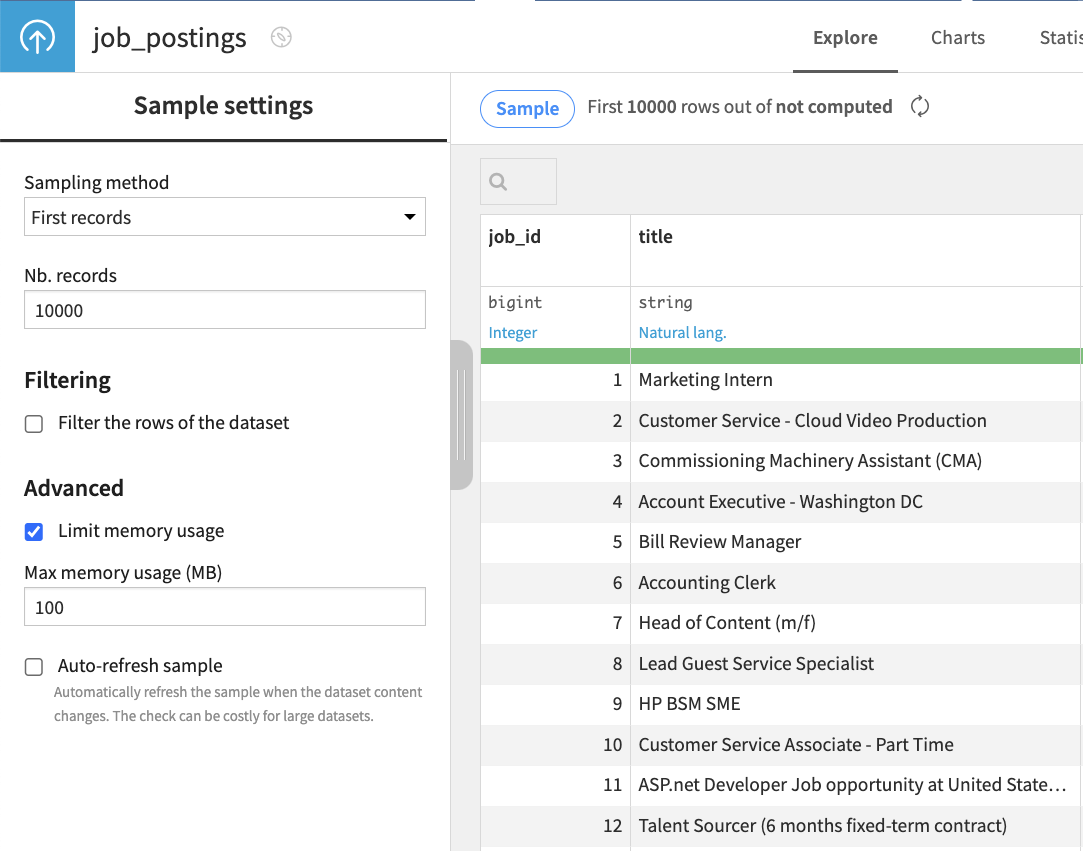
You’re Working on a Sample of Your Data
Exploring very large datasets can be unwieldy, as even simple operations can be expensive. Dataiku’s approach to solving this problem is to display only a sample when exploring and preparing data. This way, you can scroll through to explore your data and see it change as you prepare it.
The default sample for any dataset is the first 10,000 rows. You can change this by clicking Sample in the top right corner of your dataset.
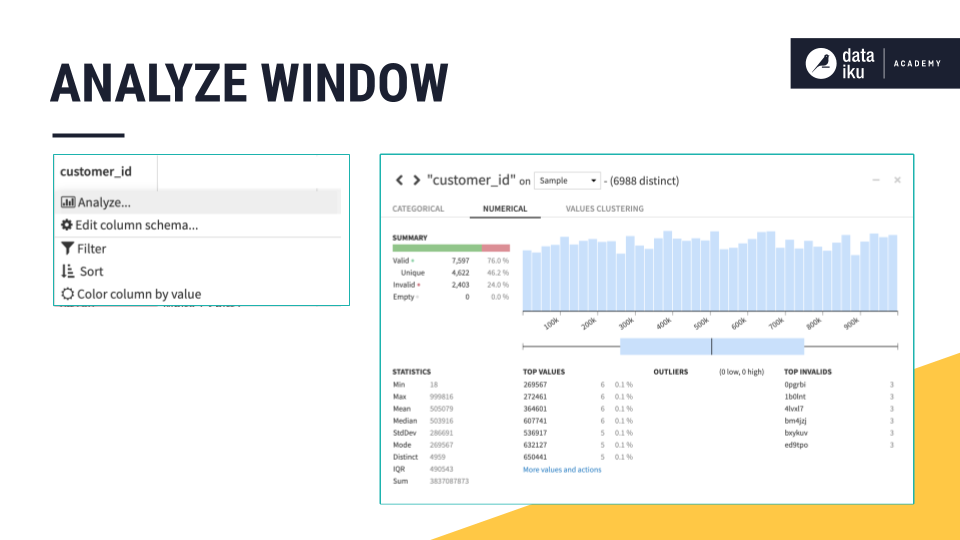
The Analyze window
Explore Your Data and Analyze Data Quality
Click any column header and select Analyze to open up the Analyze window.
You’ll get an overview of the distribution of your column data and summary statistics, counts of the most frequent values, and outliers.
You’ll also find insights into your data quality. It reveals the number of valid, invalid, and empty values, and those values that appear only once.
By default, Dataiku calculates statistics shown in the Analyze window using the dataset sample, but you can change this to get an analysis of your whole dataset.
Next steps
What to Do With Your Dataset?
Here’s a preview of the different things we can do with your dataset.
You can create cards to further analyze your data.
Learn more about the Statistics tabRecipes in Dataiku contain all the steps that transform your data. You can use visual recipes, code recipes, or machine learning recipes.
Learn more about Dataiku recipes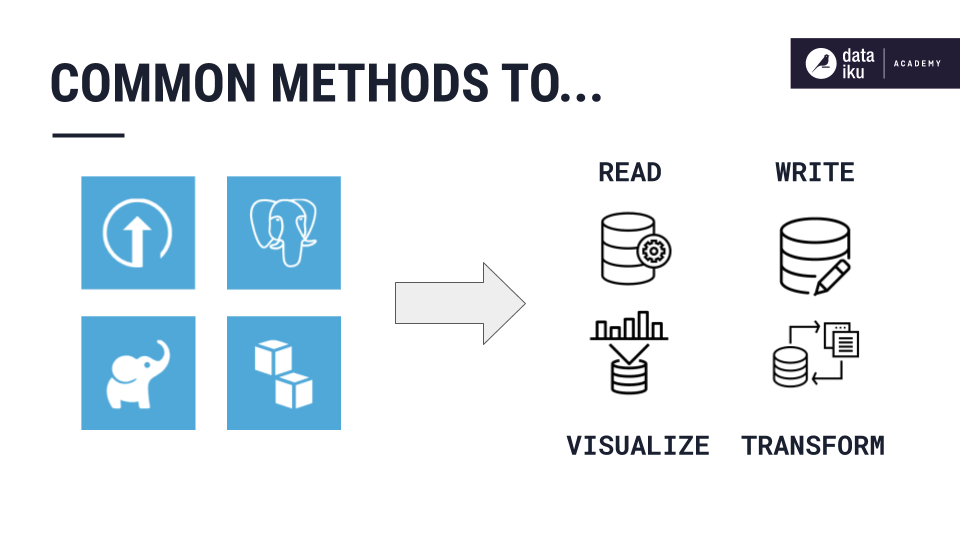
The Flow
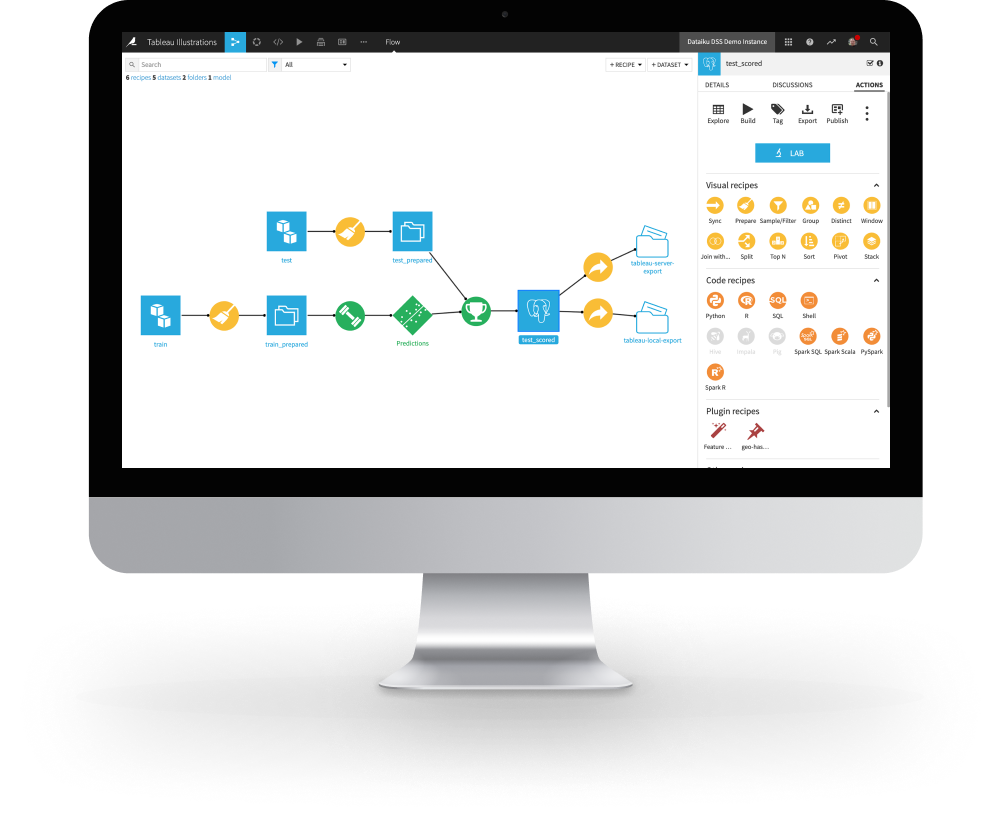
Your New Favorite Place
Your project flow is the visual representation of all the steps in your project. This is where you’ll see your datasets and all the steps to modify them, making it all the way to an output dataset. It’s a visual narrative of your project and is ideal for collaboration and tracking project dependencies.
You can always get to your project flow by clicking the Flow icon next to your project name inther top left corner.